What’s changed?
What is it?
You can now configure, analyze, and reuse metrics directly from CRM index views — the central place for Deals, Contacts, Companies, and Tickets — including automatically generated time series charts, owner and team breakdowns, and the ability to save metrics as reports.
Why does it matter?
Tracking the right metrics shouldn't mean rebuilding the same formulas in multiple places. Without a consistent way to define and reuse metrics across views, you're left manually reconciling numbers and second-guessing whether reports reflect the same logic as your CRM views.
With this update, you can define a metric once and use it across views, drill into performance with automatic time and team breakdowns, and save directly to a dashboard — all without leaving the CRM index page where you're already working.
These same metrics can also be used on your Global Home and in your board vi, increasing consistency in the numbers you see across the places you work.
How does it work?
Differences from legacy CRM metrics view
This experience fully replaces the report-based metrics previously available in the CRM with a new system that is more visually compact, with reusability and analysis baked in.
When your portal enrolls in this beta, any metrics already configured in your CRM will be migrated to the new experience. Secondary metrics will not be displayed on the page.
Choosing metrics to display in a CRM view
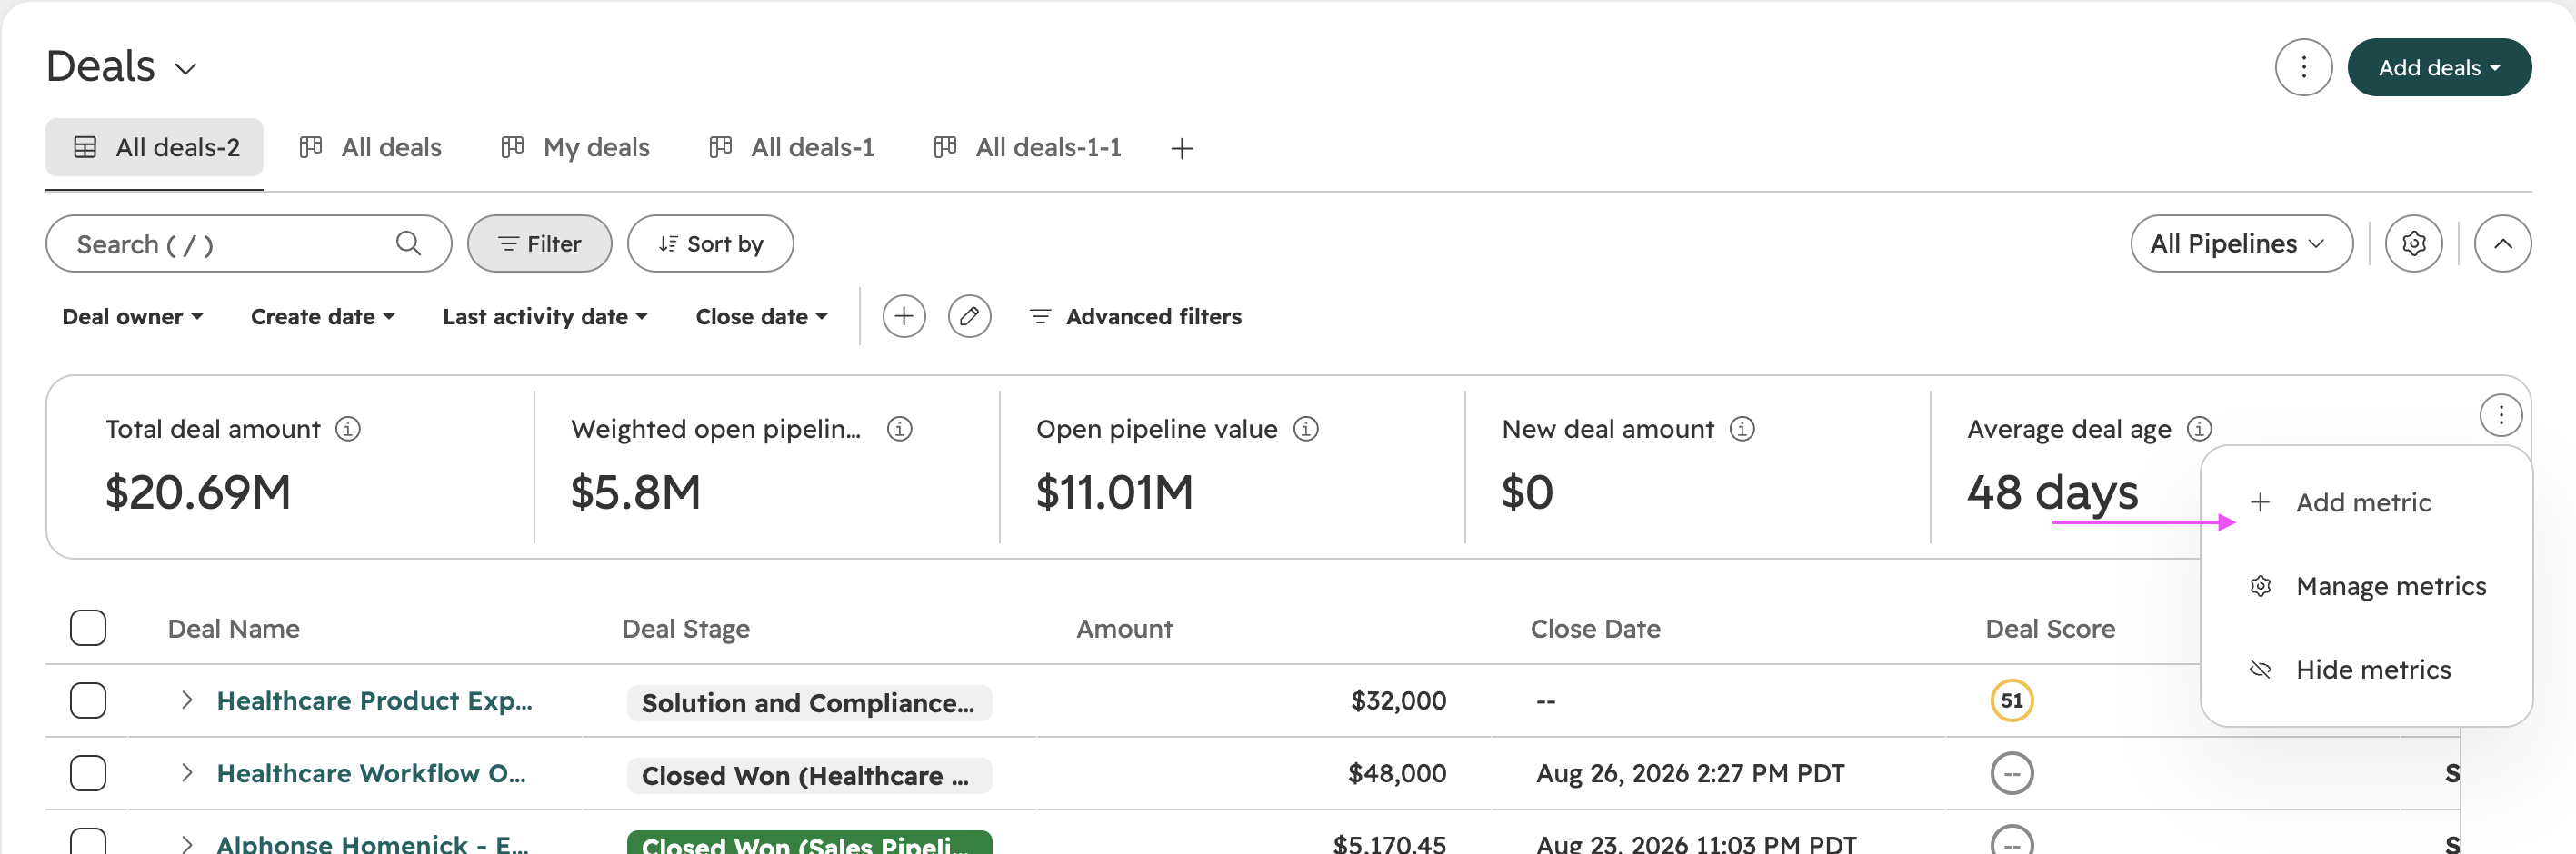
Add up to 6 metrics via the "+" button. Choose from a set of HubSpot-defined metrics or create your own definitions based on your portal's data model.
Analyzing metrics in depth
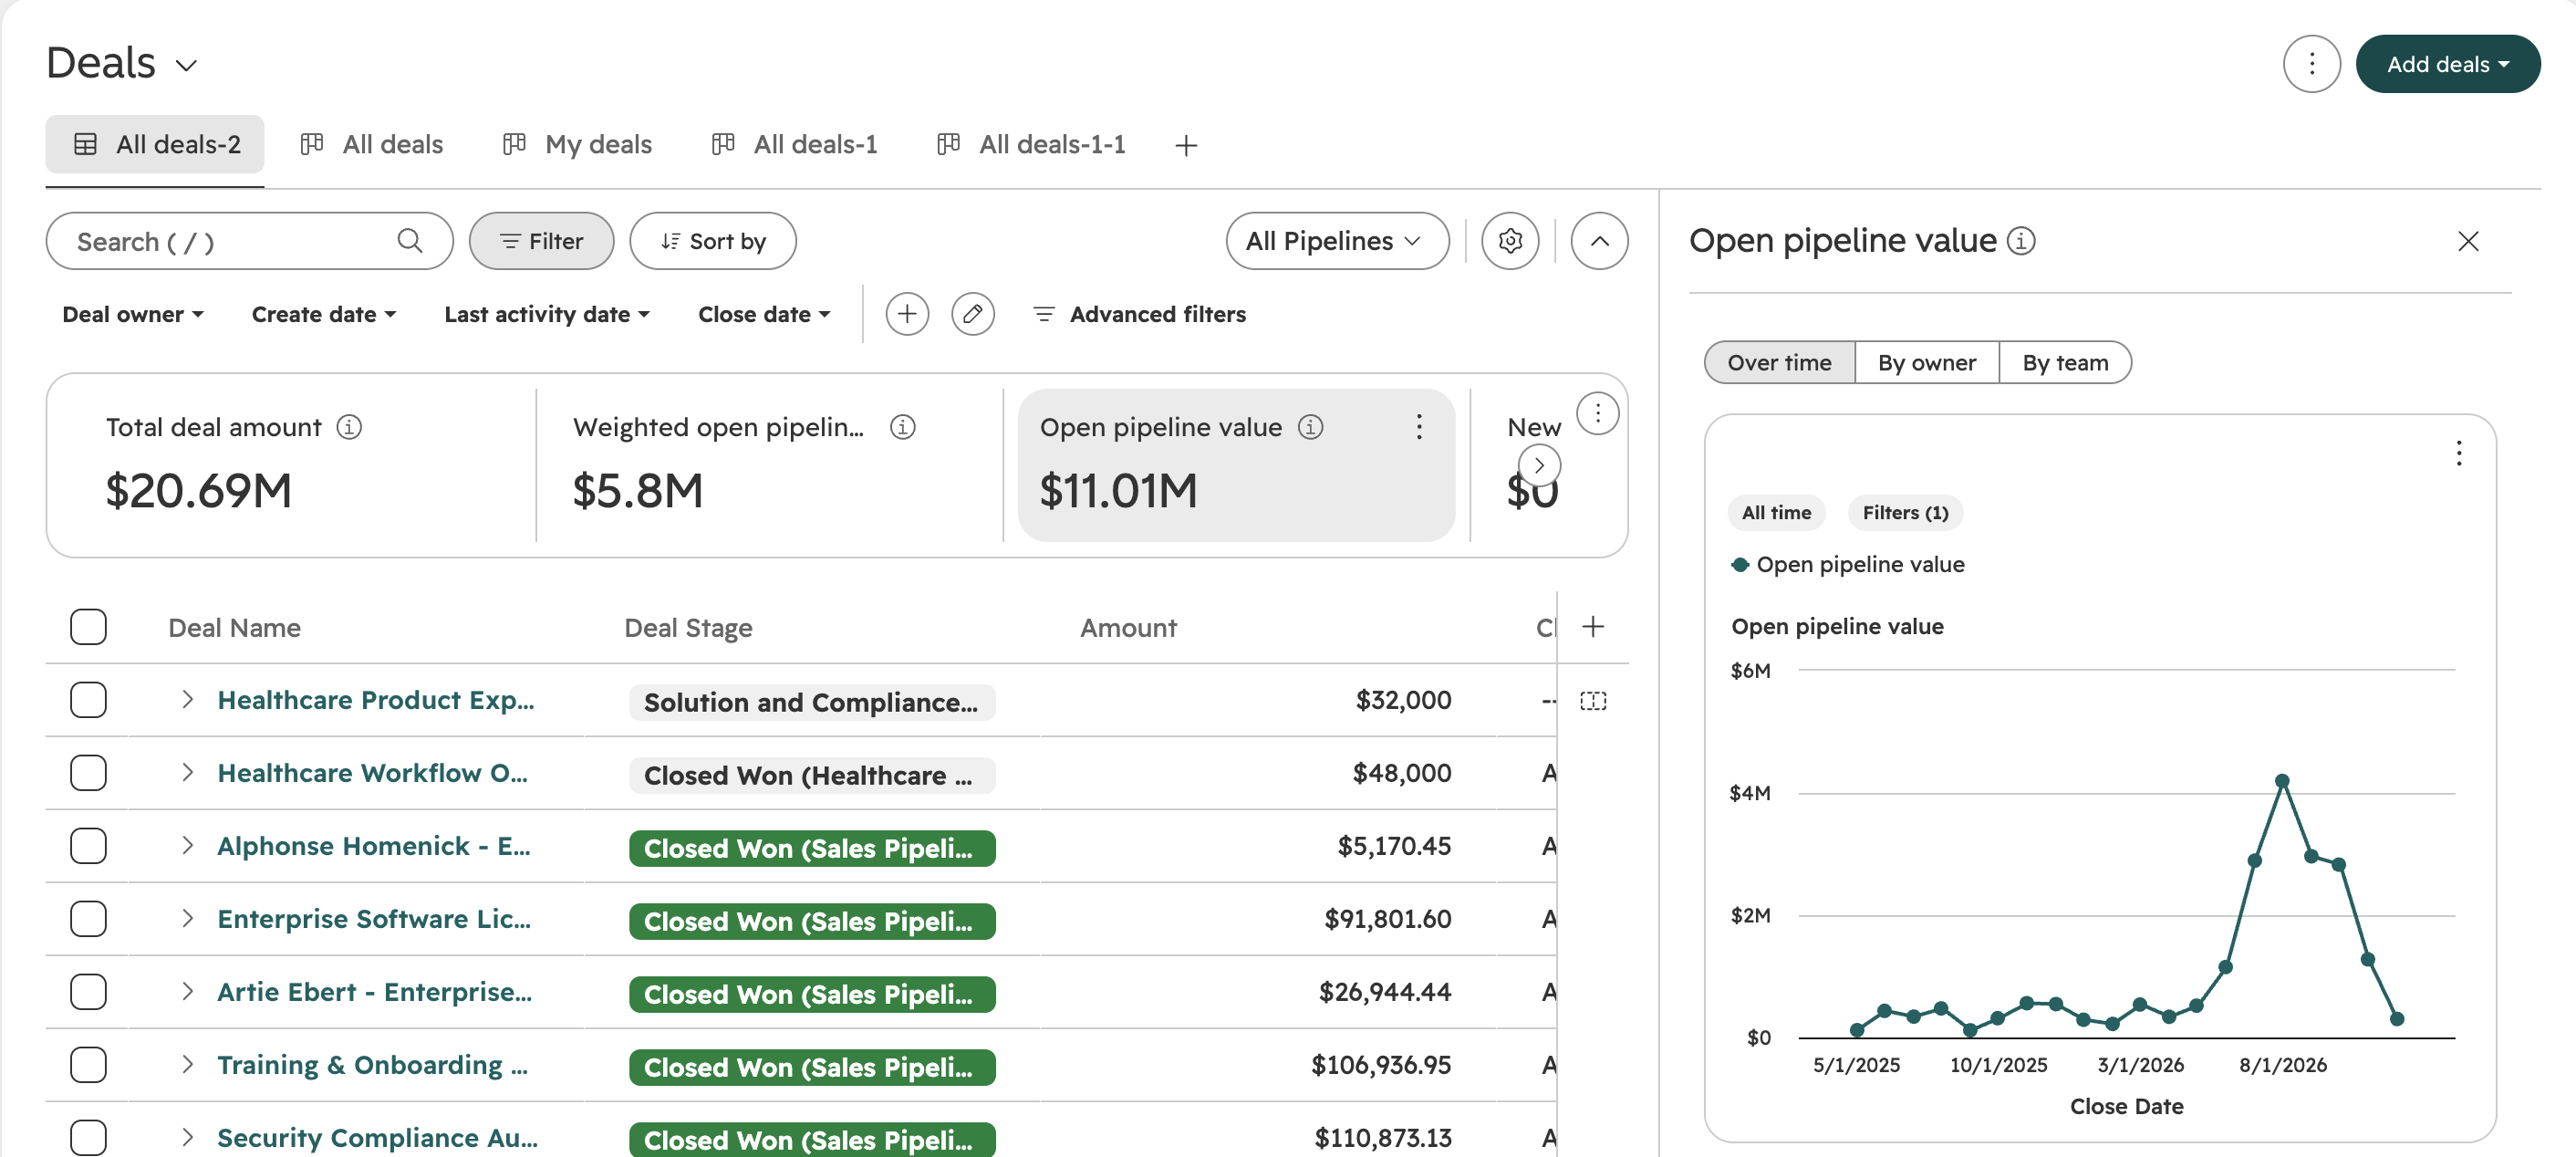
Click on the metric to open a chart view and AI-generated insight about the metric. You can view the metric over time or broken down by owner or team.
Creating a new metric
Click the "+" button and then "Create new metric" to open a side panel for configuring a new metric.
Available configuration options:
- - Name — the display label for the metric
- - Description — how the metric should be used
- - Custom Formula or Property and Aggregation — the calculation to perform on the amount property (Sum, Average, Min, Max)
- - Filter By Date — for time-filtered views, the date property used to include or exclude records from the calculation
- - Filters — optional conditions to scope the metric to specific records (e.g., "Is closed won = True")
Removing, editing or saving a metric
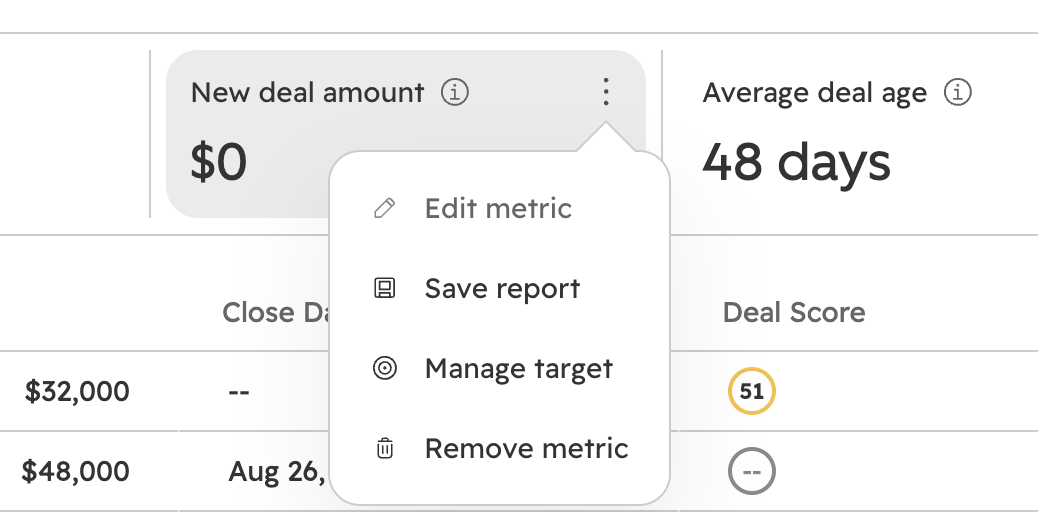
Hover over any metric and click the vertical three-dot icon to access options to edit, save as a report, or remove the metric from your view.
Hiding the metrics bar
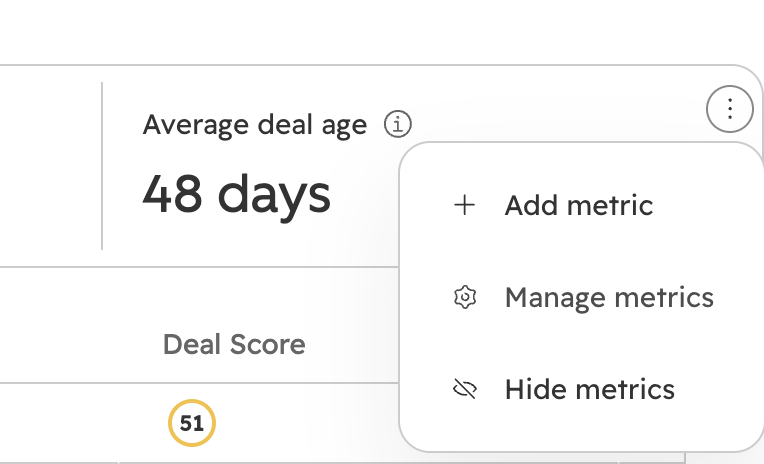
- Click the triple-dot button in the metrics bar.
- Select Hide metrics to fully hide the section
Managing metrics in bulk
3. Click the triple-dot button in the metrics bar.4. Select Manage metrics to open a modal with all metrics in your portal
Who gets it?
All hubs and tiers