What is it?
We are excited to announce the Public beta for supporting form submissions as a data source in the Custom Report Builder.
Why does it matter?
You can now build a variety of reports based on form submissions to understand how your forms are performing, slice and dice form submissions data and much more.
How does it work?
- Under custom report builder, select "Forms", "Form Submissions" and "Form Analytics" as the data sources. Also select other required data sources such as Contacts, Companies etc.
- Using the various data sources selected, pull the required fields.
- Apply the necessary filters
- Choose the appropriate chart types for your report.
- Break down the selected data as required.
- Now, you should see the report populated
- You can also add the reports your dashboards.
Below are some of the reports that you can build:
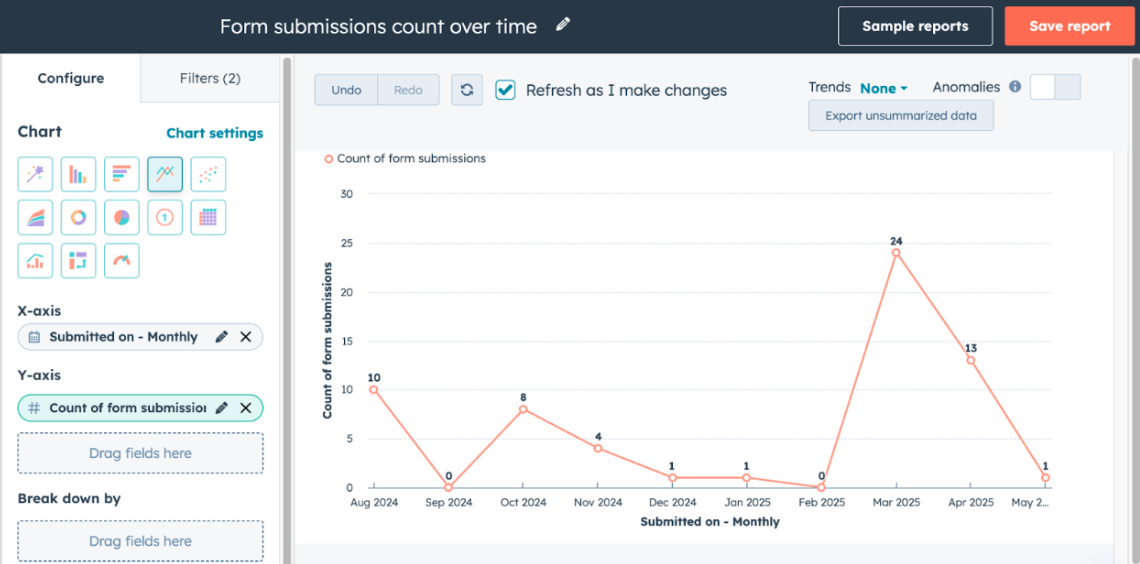
- Form submissions count over time
- Data Sources to Select: Form Submissions(Primary), Forms
- Properties to select:
- X-axis : Submitted on
- Y-axis : Count of form submissions
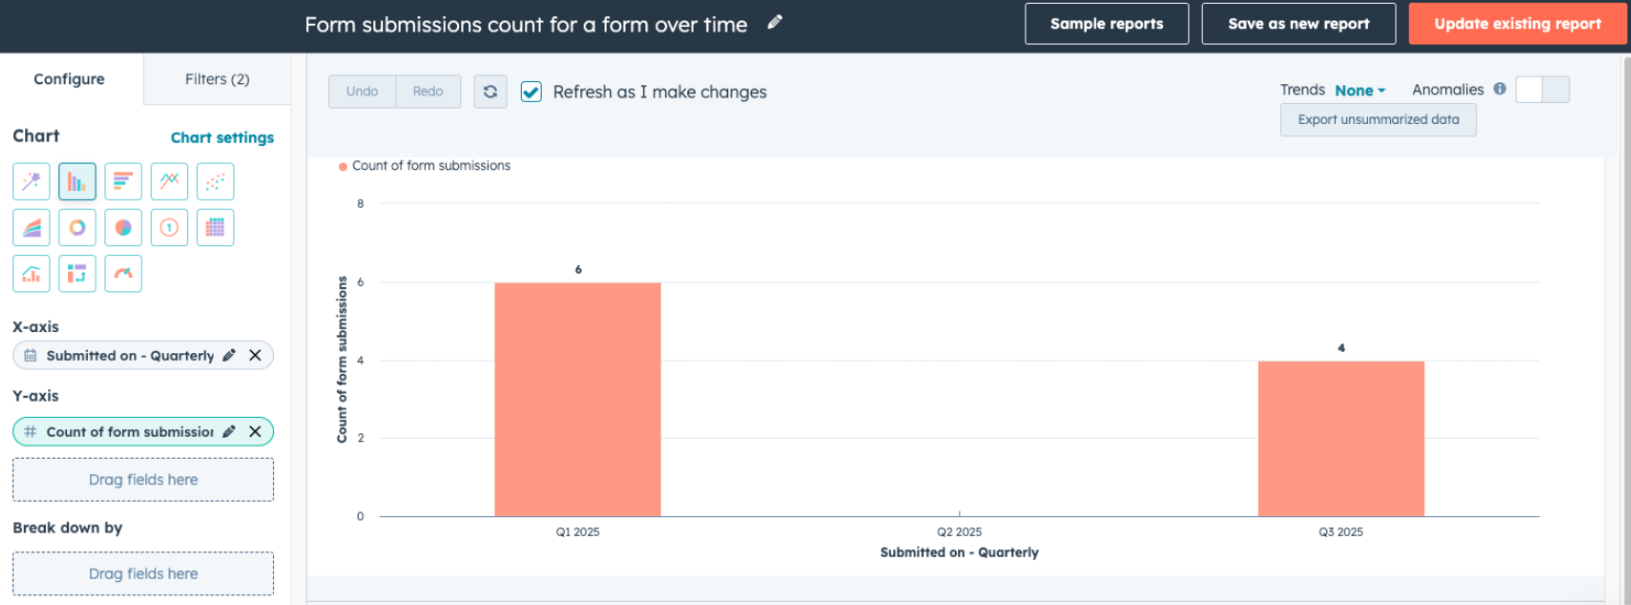
- Form submissions count for a form over time
- Data Sources to Select: Form Submissions(Primary), Forms
- Properties to select:
- X-axis : Submitted on
- Y-axis : Count of form submissions
- Filter by: Name(Form Name)
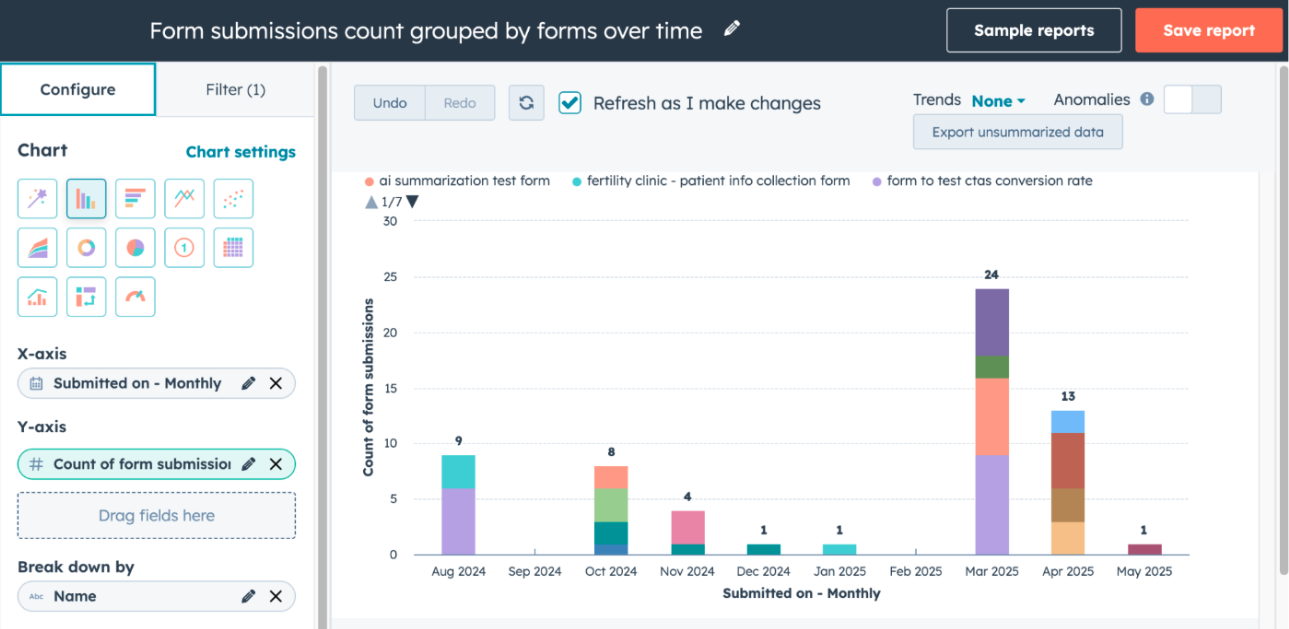
Form submissions count grouped by forms over time
-
- Data Sources to Select: Form Submissions(Primary), Forms
- Properties to select:
- X-axis : Submitted on
- Y-axis : Count of form submissions
- Break down by : Name (Form name)
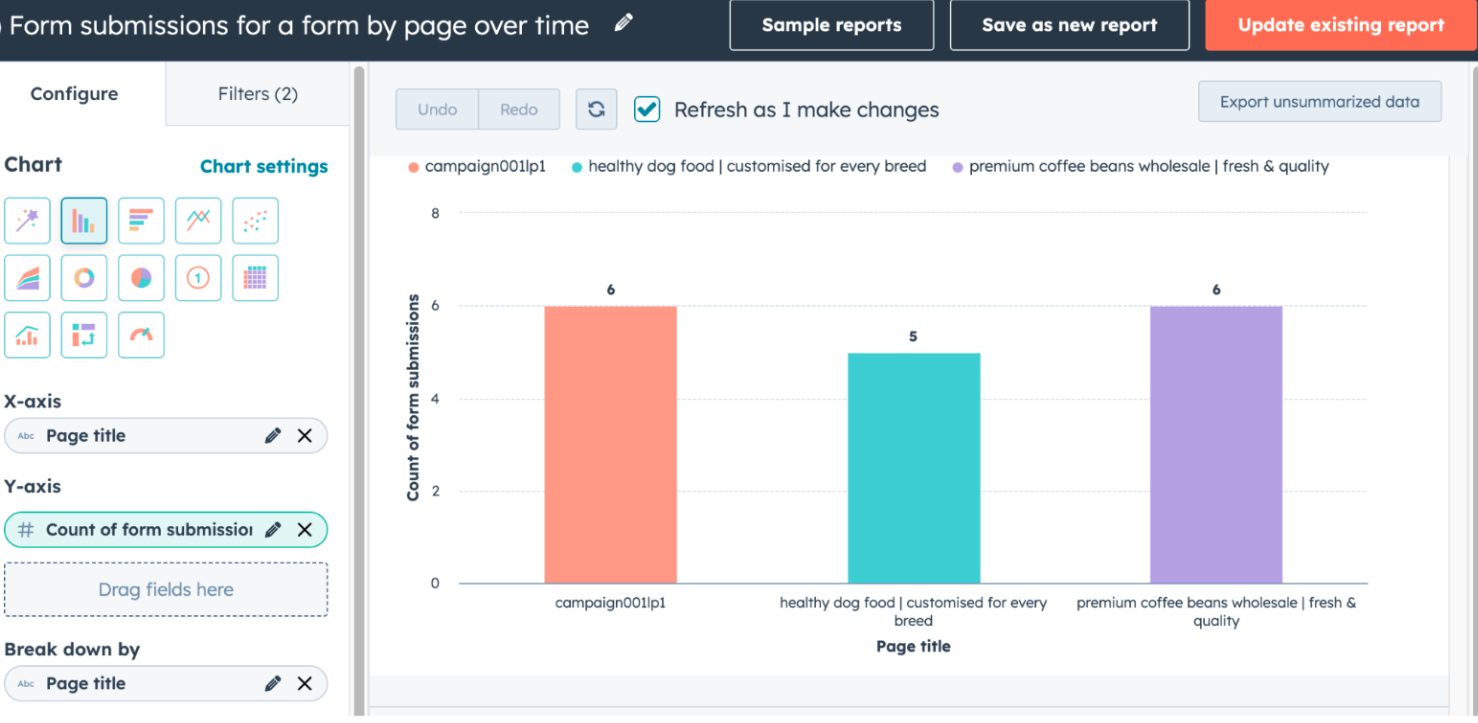
- Form submissions count for a form by page over time
- Data Sources to Select: Form Submissions(Primary), Forms
- Properties to select:
- X-axis : Page title
- Y-axis : Count of form submissions
- Break down by : Page title
- Filter by : Name(Form name)
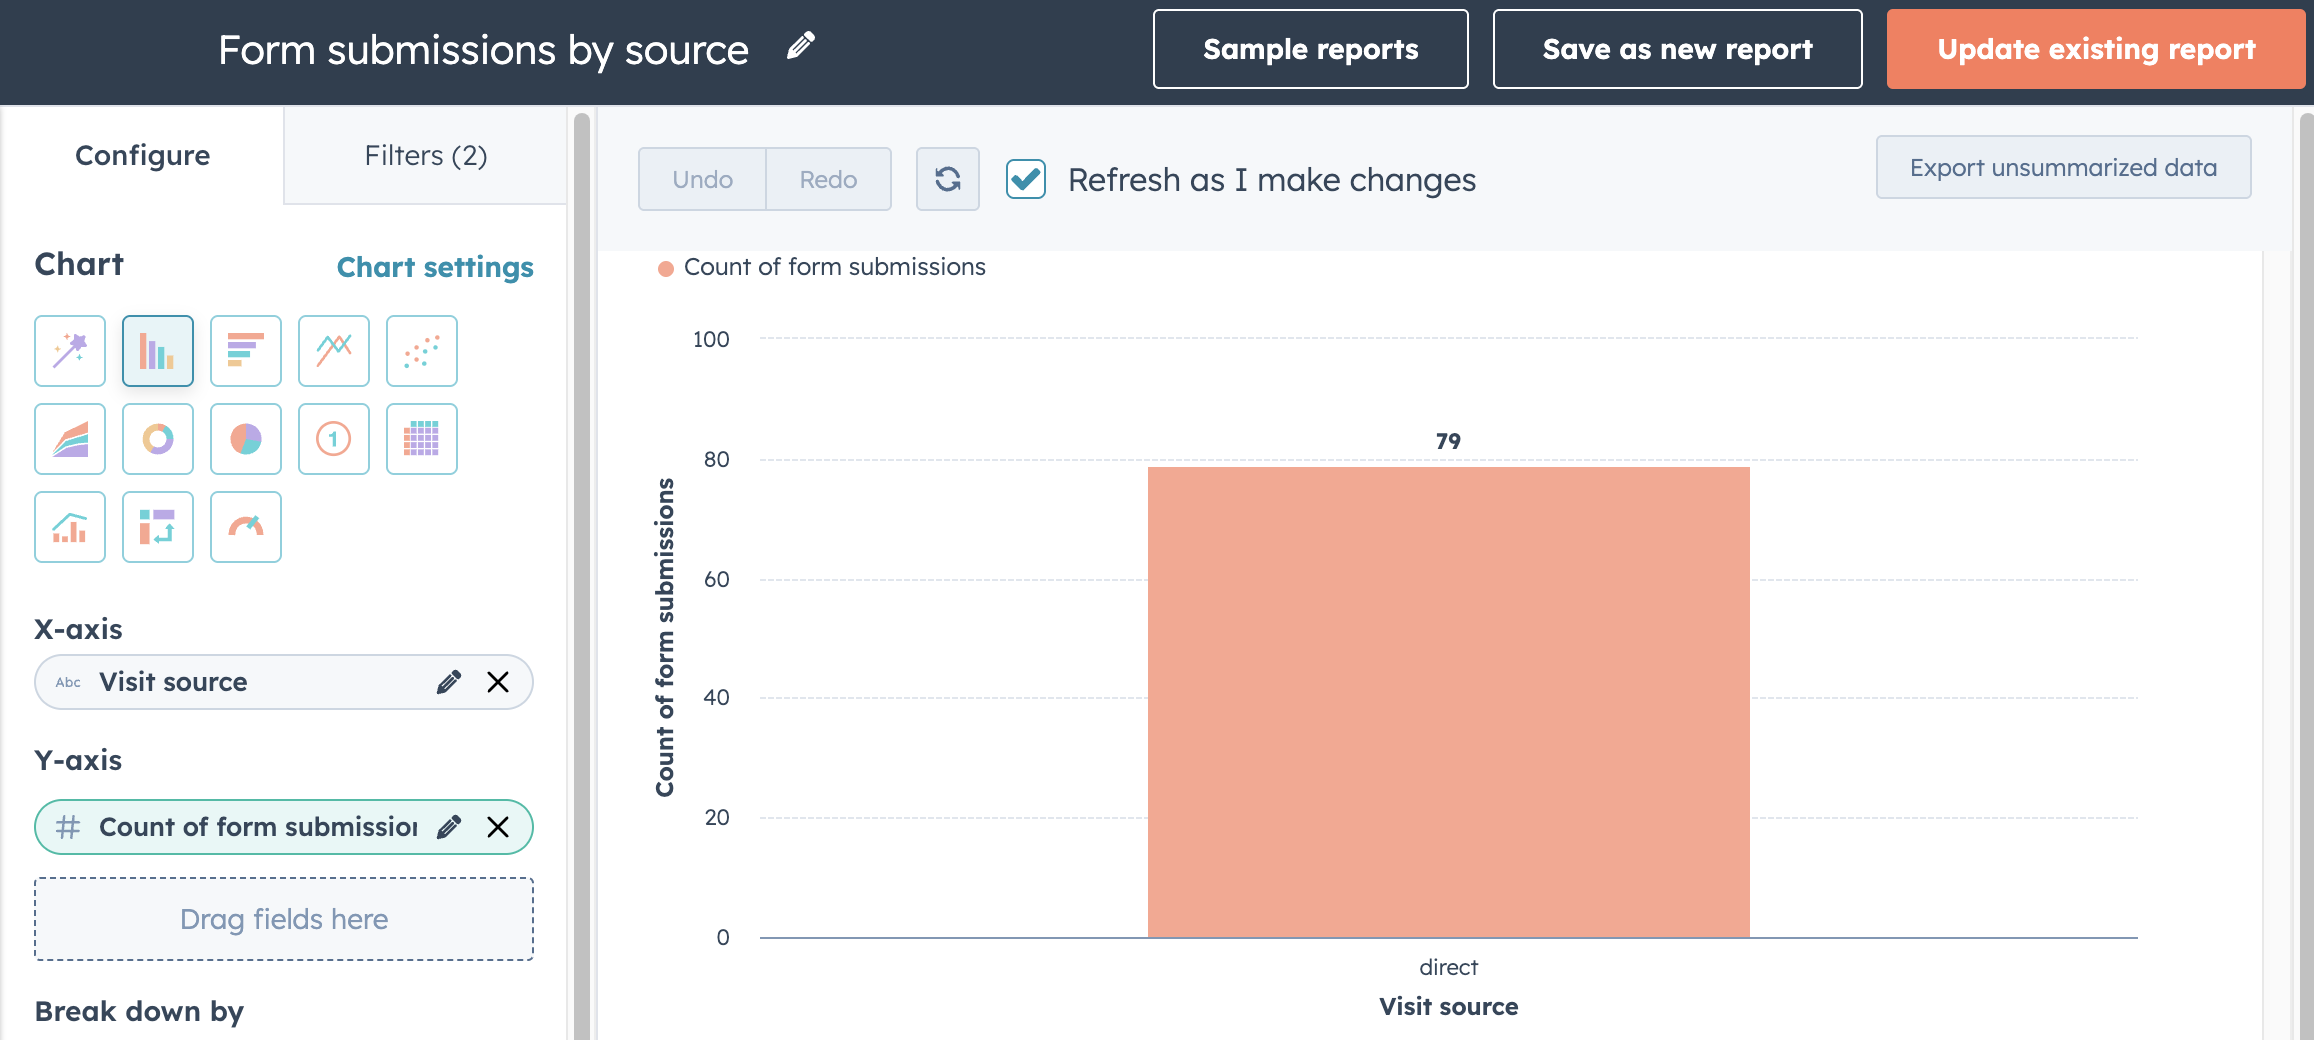
- Form submissions count by source
- Data Sources to Select: Form Submissions(Primary), Forms
- Properties to select:
- X-axis : Visit Source
- Y-axis : Count of form submissions
- Break down by : Visit Source
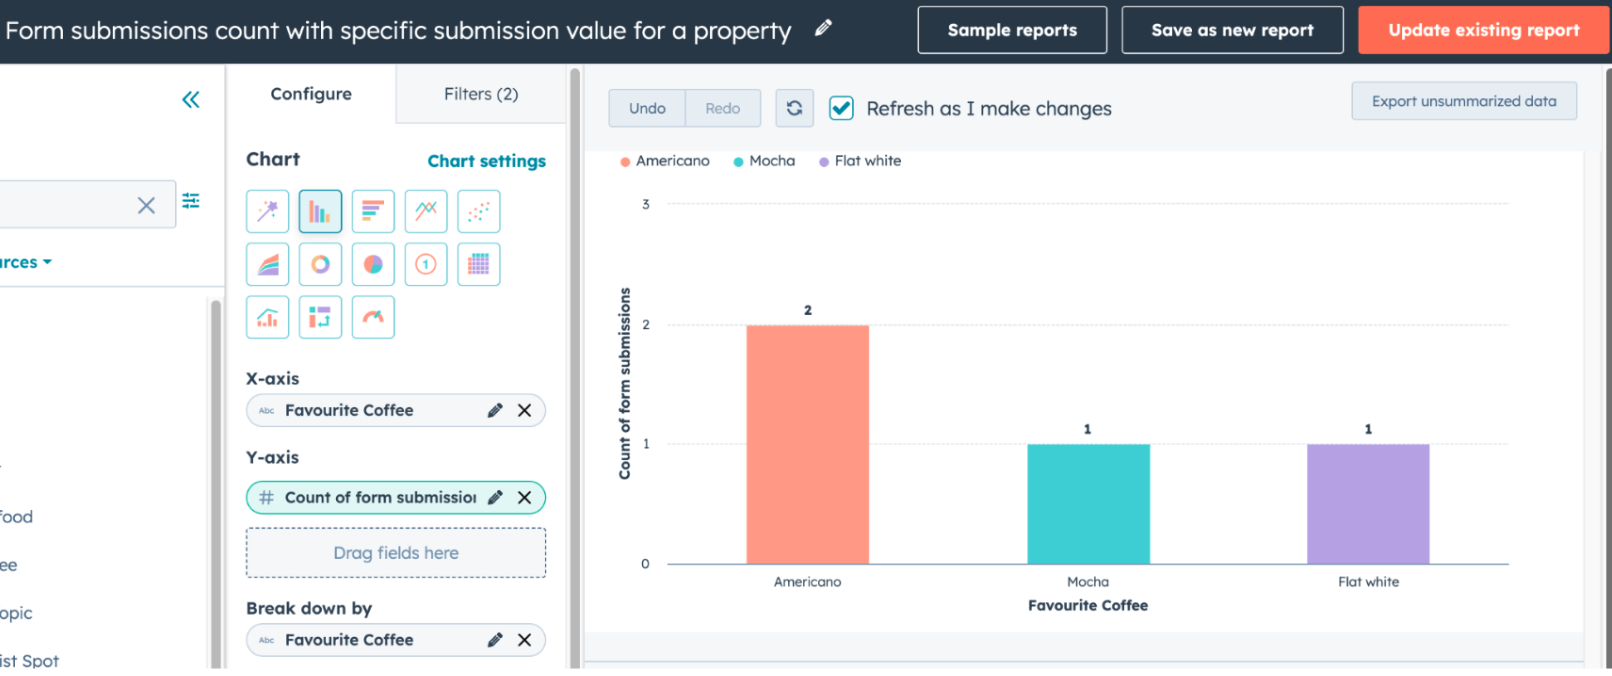
- Form submissions count with specific submission value for a property
- Data Sources to Select:Form Submissions(Primary), Contacts
- Properties to select:
- X-axis : Property of choice (Example: Favorite Coffee)
- Y-axis : Count of form submissions
- Break down by : Property of choice (Example: Favorite Coffee)
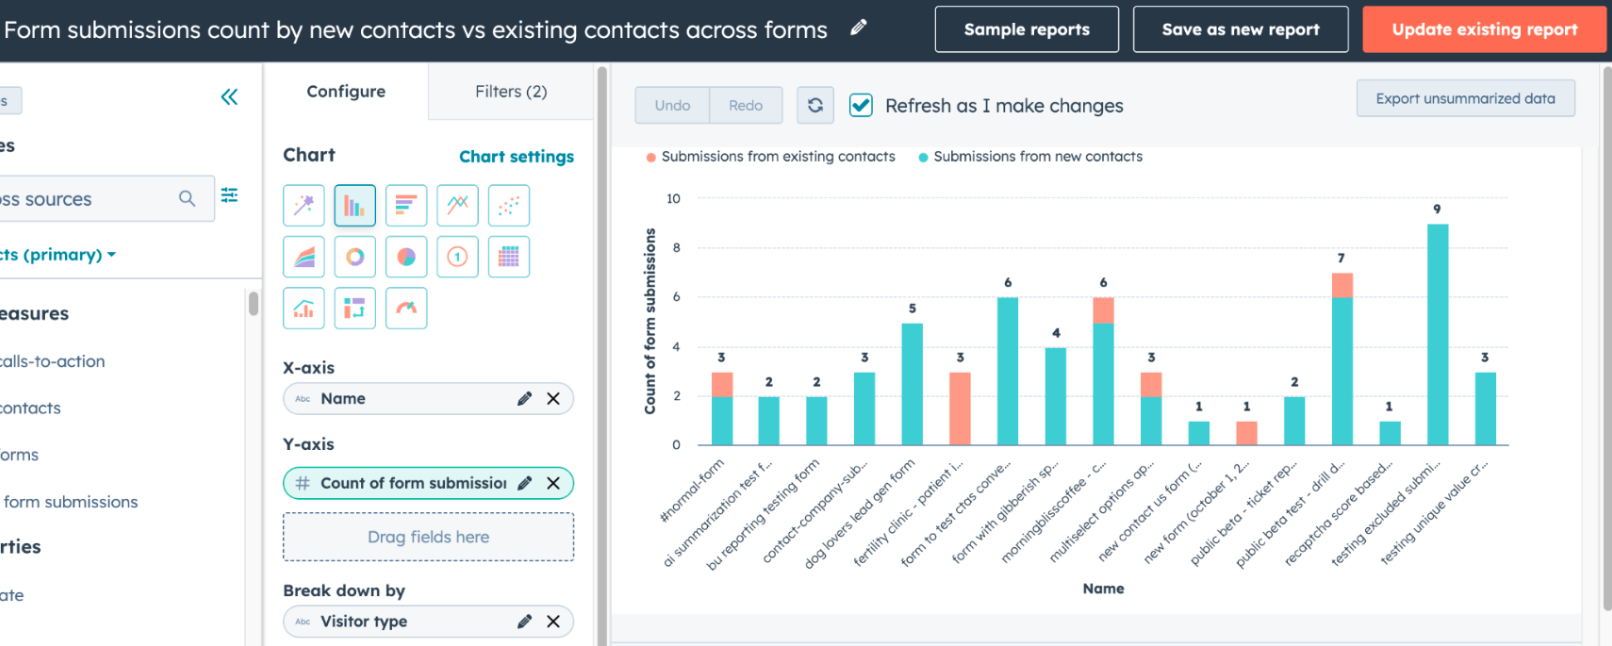
- Form submissions count by new contacts vs existing contacts across forms
- Data Sources to Select: Form Submissions(Primary), Forms
- Properties to select:
- X-axis : Name (Form Name)
- Y-axis : Count of form submissions
- Break down by : Visitor Type
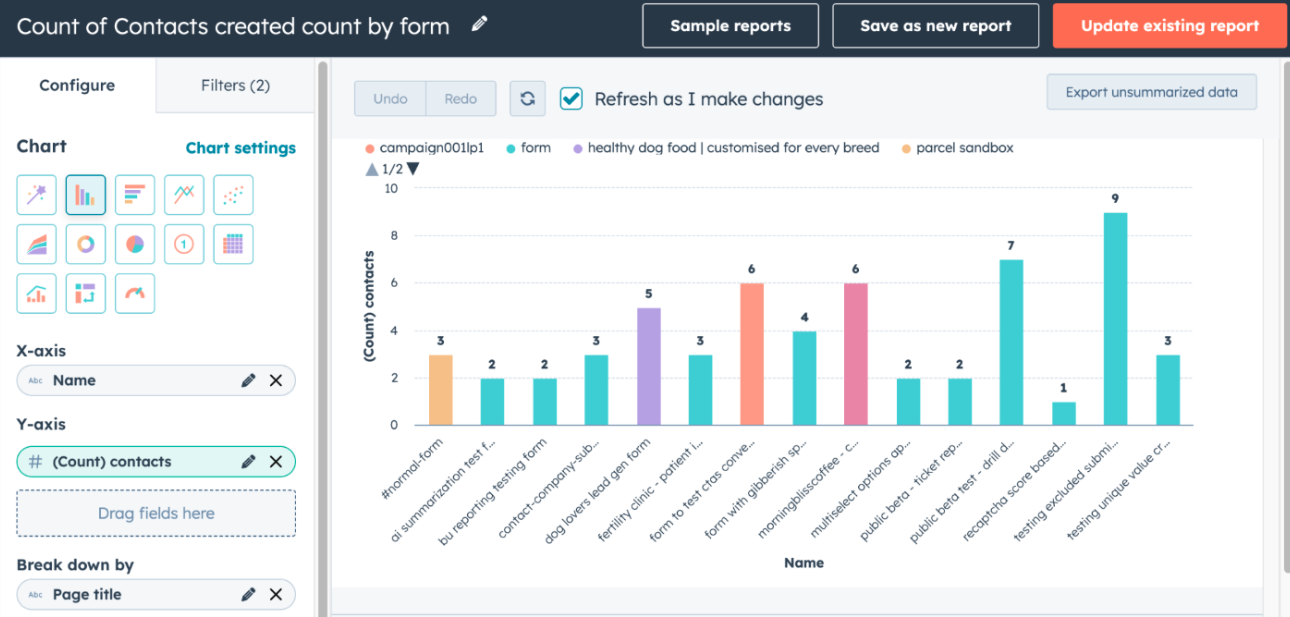
- Count of Contacts created by form
- Data Sources to Select: Form Submissions(Primary), Forms
- Properties to select:
- X-axis : Name (Form Name)
- Y-axis : Count of Contacts
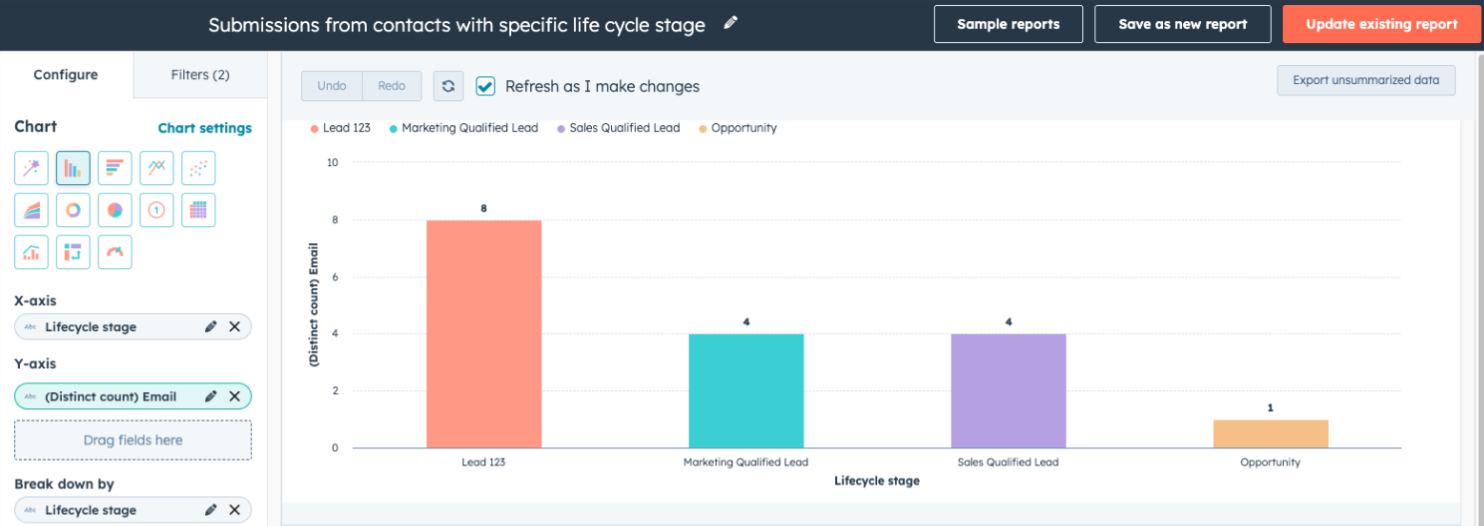
- Submissions from contacts with specific life cycle stage
- Data Sources to Select: Form Submissions(Primary), Forms
- Properties to select:
- X-axis : Lifecycle stage
- Y-axis : Distinct Count of Email
- Breakdown by : Lifecycle stage
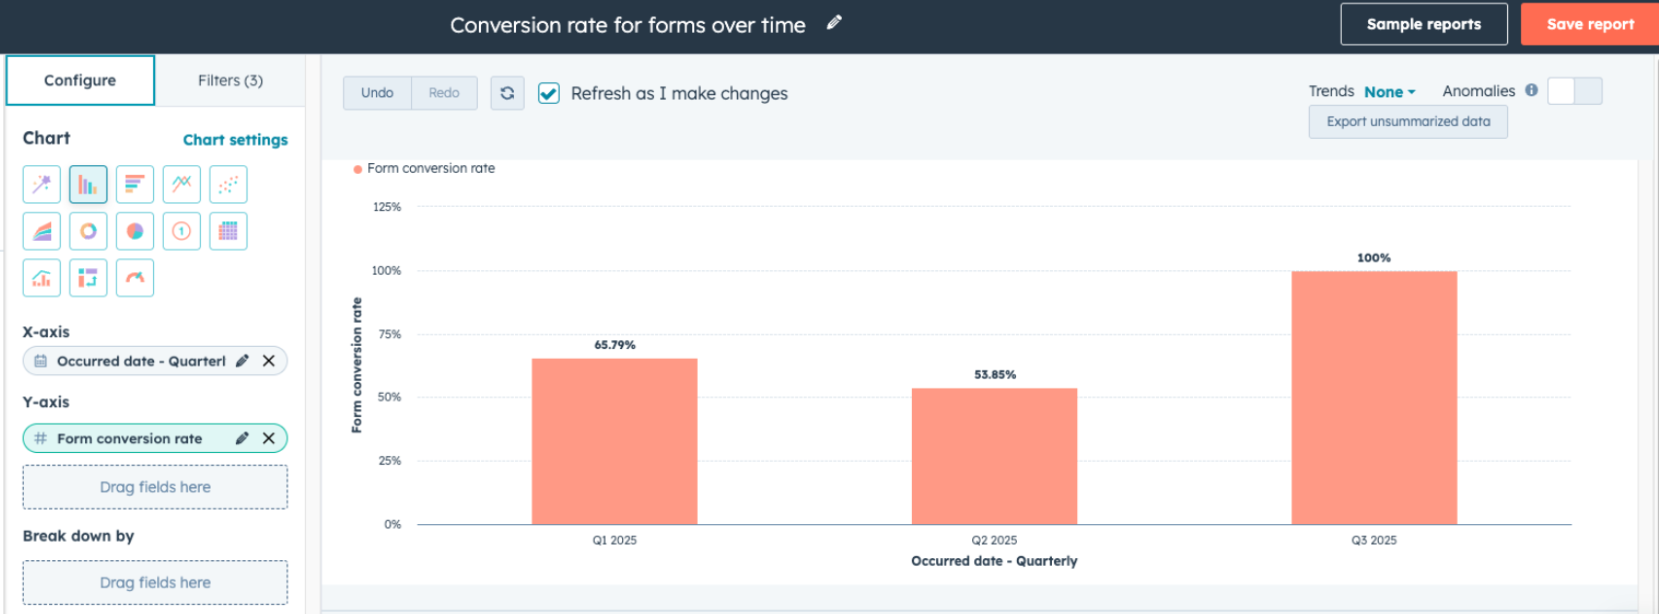
- Conversion rate for forms over time
- Data Sources to Select: Form Analytics(Primary), Forms
- Properties to select:
- X-axis : Occurred Date
- Y-axis : Form Conversion Rate
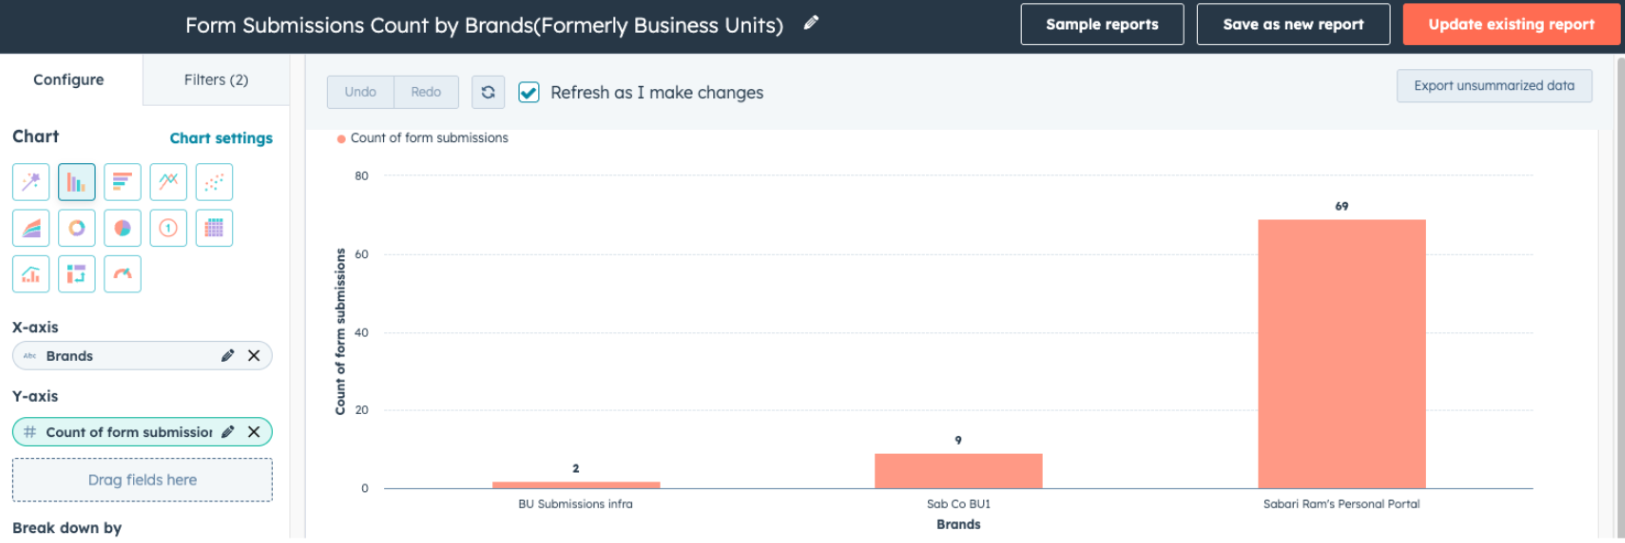
- Form submissions Count by Brand
- Data Sources to Select: Form Submissions, Forms
- Properties to select:
- X-axis : Brands (from Contacts data source)
- Y-axis : Count of form submissions
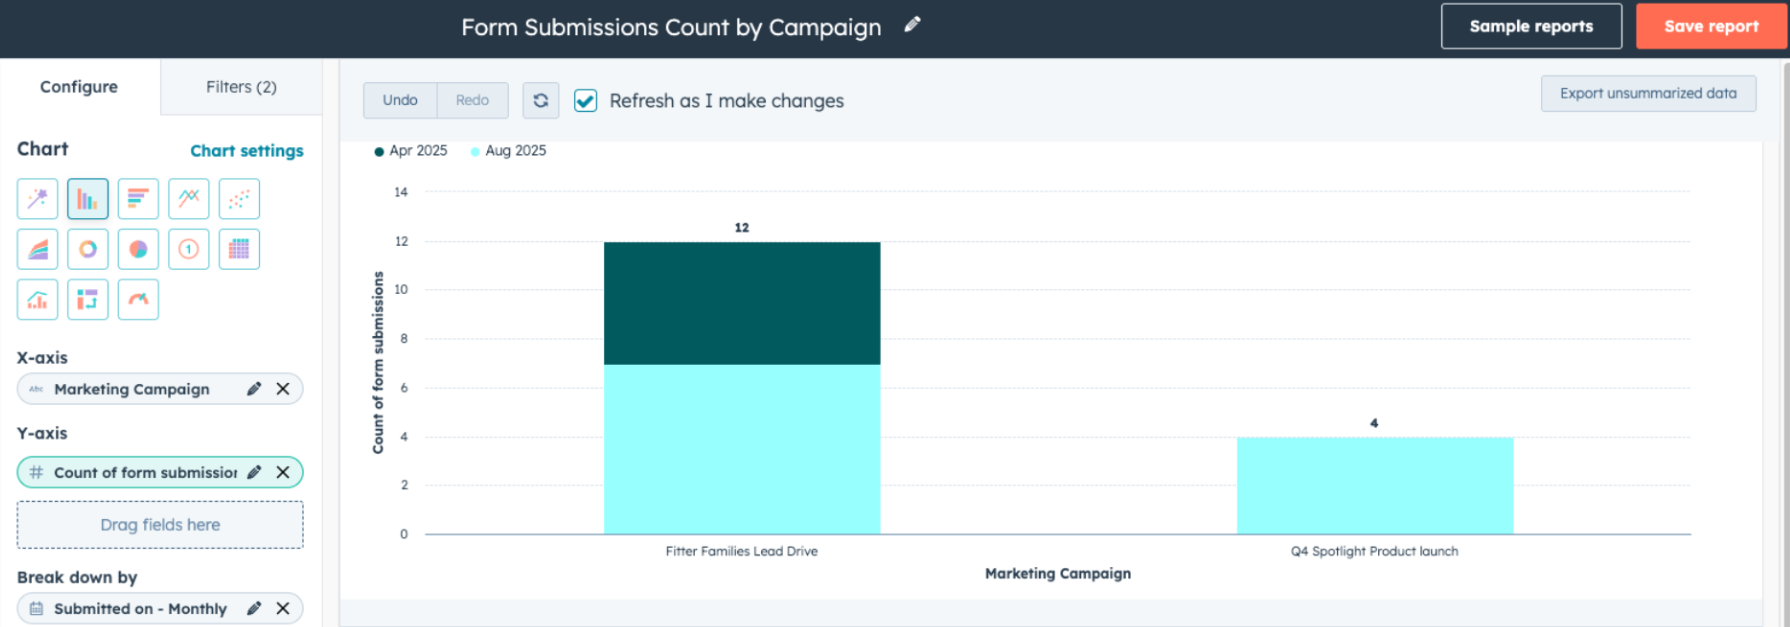
- Form submissions Count by Campaign
- Data Sources to Select: Form Submissions, Forms
- Properties to select:
- X-axis : Marketing Campaign (from Forms data source)
- Y-axis : Count of form submissions
- Break down by: Submitted on (from Form Submissions data source)
Who gets it?
Content Pro, Content Enterprise, Marketing Pro, Marketing Enterprise, Ops Pro, Ops Enterprise, Sales Pro, Sales Enterprise, Service Pro, Service Enterprise
.png?width=193&name=jos%20(1).png)


