What is it?
App usage Insights provide partners the ability to:
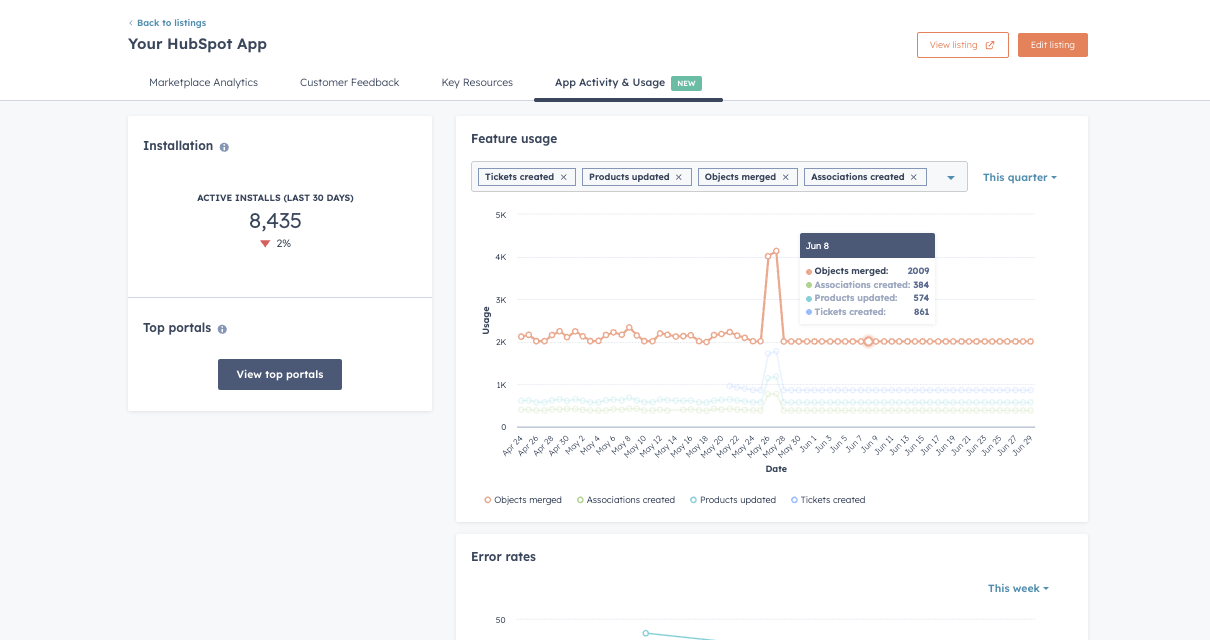
1. Select API operations to view daily, weekly, and monthly trends in usage, based on public APIs
2. Identify top portals and portal usage
3. View Active Installations and Active Installation trends over the past 30 days
Why does it matter?
Partners are able to build better apps when they have insights into their user base and activity trends. App partners will now be able to:
- Filter by API operation to see trends in usage as well as the top power users for these operations and
- See their top portals for overall activity
- View accurate Active Install accounts within their insights with trend data
- View summary breakdown and trends of API errors, sorted by client-side, server-side, auth or rate-limiting errors.
How does it work?
This is an extension of our Marketplace Analytics page and can be found within app management portals for your respective HubSpot app.
All successful Public API activity will be summed and displayed here. For active installs, your total includes installations generating one API call (at least) within the past rolling 30 day period to be included.
Some partner app activity which does not result in API activity will not be totaled; we will be exploring additional support for activity without API calls at a later iteration.
Who gets it?
All hubs and tiers

.png?width=193&name=jos%20(1).png)


